A mental or cognitive map is produced by mental process. This one was drawn by my wife, Laura, and describes our living room, but mental maps are limited only by the skills of learning, recalling and fabricating. Although there are significant differences from real maps, they do share attributes of scale, orientation and symbolism.
Friday, August 8, 2008
Pie Chart
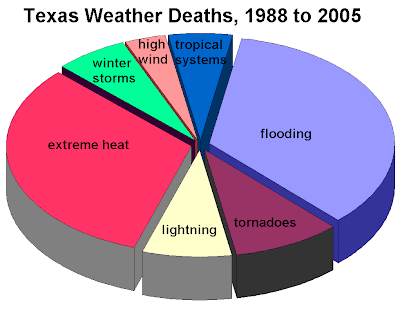
Pie Charts are some of the first forms of geovisualization to be developed. They are divided into sectors, illustrating relative magnitudes or frequencies or percents.
This chart shows the cause of weather-related deaths in Texas from 1988 to 2005.
web site - http://www.srh.noaa.gov/lub/images/safety/swaw/tx-deaths-1988-2005-wx-pie-graph.gif
3D Parallel Coordinate Graph
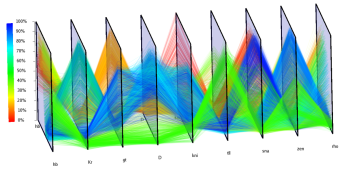
A parallel coordinate graph is used to plot large multivariate datasets.
To enable visualization of the expression of many genes in parallel, the creators of this graph adapted parallel coordinates to visualization of 3D gene expression data.
In parallel coordinates, each gene is represented by one parallel axis. The expression levels of a cell define a point on each axis. By connecting the corresponding points of neighboring axes, each cell can be represented by a polyline.
Lorenz Curve
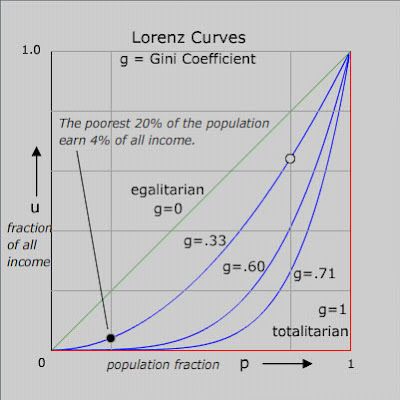
A lorenz curve is a graphical representation of where a group of plots stand mathematically relative to the line of perfect equality.
It shows the proportion of the distribution assumed by the bottom y% of the values.
web site - http://chesters.org/marvin/GINI/index.html
Isoline Map
Climograph
Box Plot
Subscribe to:
Posts (Atom)