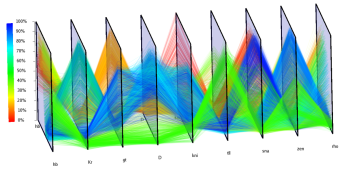
A parallel coordinate graph is used to plot large multivariate datasets.
To enable visualization of the expression of many genes in parallel, the creators of this graph adapted parallel coordinates to visualization of 3D gene expression data.
In parallel coordinates, each gene is represented by one parallel axis. The expression levels of a cell define a point on each axis. By connecting the corresponding points of neighboring axes, each cell can be represented by a polyline.
No comments:
Post a Comment