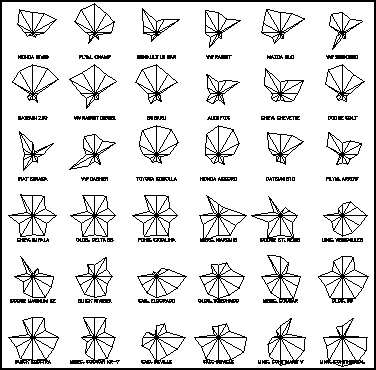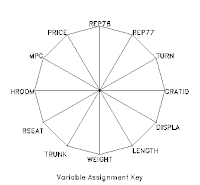

Visualizations display information other than geographical. Star Plots are graphic visualizations of multiple variables. The 12 variables in this plot comparing features of automotive models are arranged around the perimeter as shown in the variable key. Each star represents one car model; each ray in the star is proportional to one variable.
No comments:
Post a Comment