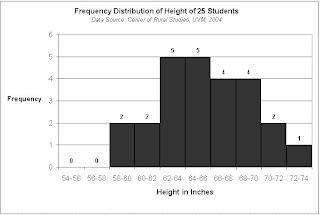
 A histogram is a graphical display of tabulated frequencies. In this case, what's being tabulated is the frequency of distribution of height among students in one class.
web site - http://www.math.kent.edu/~honli/teaching/statistics/Chapter2/Excell_Histogram.html
No comments:
Post a Comment