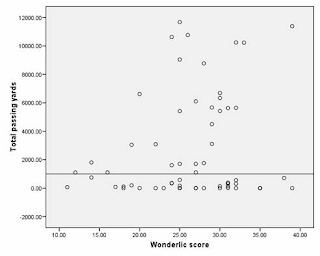
A map can take on the form of a scatterplot - a data visualization in which one can communicate up to four mathematical variates. As a football fan, I like this one (as a sports fan) because it plots the wonderlic (an IQ test) scores for NFL players before entering the rookie draft and their total career passing yards.
No comments:
Post a Comment