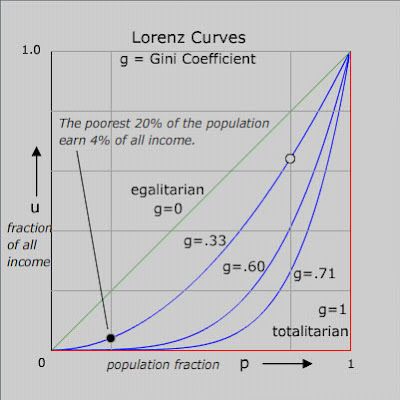
A lorenz curve is a graphical representation of where a group of plots stand mathematically relative to the line of perfect equality.
It shows the proportion of the distribution assumed by the bottom y% of the values.
web site - http://chesters.org/marvin/GINI/index.html
No comments:
Post a Comment