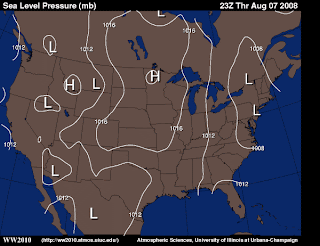
This is an isobaric (air pressure) weather map. The lines (contours) signify areas of common pressure. High pressure areas are usually clear while low pressure areas bring wind and precipitation. Lines that are close together mean strong winds.
web site - http://ww2010.atmos.uiuc.edu/(Gh)/wx/cwp/prods/current/sfcslp/sfcslp_N.gif
No comments:
Post a Comment